Dollar History
1:
from 1915
2:
from 1940
3:
from 1971
4:
from 2008
Last update
(excluding graph):
18-Aug-2016
©1996-2014
Mike Todd
![]()
| << Dollar history from 1971 |
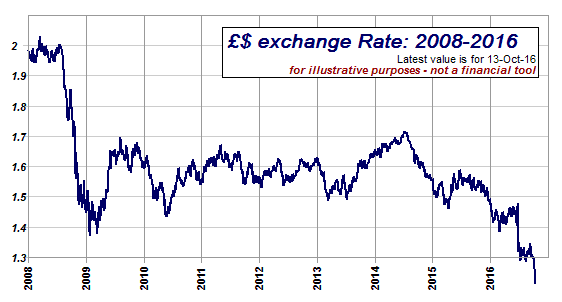
4: Dollar Exchange Rate from 2008
At the beginning of 2008 the dollar was still reeling from the various financial crises, and the global credit crunch, and the pound hovered just under the $2.00 mark. But this rise couldn't be sustained.
As well as global confidence returning to the USA, and a stabilising financial system, one of the factors that had hit the American economy (the "sub-prime"loan crisis) started to affect the UK. This
rise couldn't be sustained, and the very things that had hit the American
economy, such as the "sub-prime" loan crisis, started to affect
the UK.
2009 began with the financial "crisis" worsening, and the UK going into recession. The pressure on the pound conitnued to push it downwards. The closing value on 12th March, 2009, was just over £1=$1.3765 - the lowest in 25 years.
But, thanks to strong fiscal policies, sterling recovered rapidly soon afterwards. only to drop again a year later as Europe was hit by the Greek debt crisis, which had the effect of strengthening the dollar. But the pound recovered from that as well, and continued to hover between $1.55 and $1.65 until the start of 2013.
By the end of 2013, a number of factors saw the pound starting a steady and sustained rise. Although there are differences of opinion as to exactly what those factors were, the two that had the greatest consensus were the strong economic policies that were at last pulling the UK out of its economic troubles. The other was the reassurances of the stability in the UK's union with Scotland, as polls continued to show an increasing probability of the Scottish rejection of independence.
When the Scottish independence polls started to suggest a pro-independence vote, and the currency markets reacted with a drop in the pound's value, despite the markets overall believing fairly strongly that the vote would go against independence. In the end, the NO vote to Scottish independence had relatively little effect on the value of the pound, which continued its slide through the rest of the year and into 2014.
However, poor economic growth and the fact the the Bank of England chose not to increase interest rates, saw a steady and prolonged weakening of the pound. There was a small increase in the middle of 2015, but the decline continued through the rest of 2015 and into 2016, spurred on by the US increasing its interest rates.
In fact 2016 started with the pound at its lowest level in 7 years, at only $1.42, and the February announcement of a referendum on the UK's continued membership of the EU seems not to have done much to address the uncertainty. However, polls were indicating that the referendum vote would be to remain in the EU, and this (at least according to some experts) slowed down and reversed the pound's gradual weakening.
As referendum day (23rd June, 2016) approached, the close polls were unsettling the markets, and the pound weakend a little, dropping from $1.47 to $1.42, but then recovering to just under $1.48
The vote to leave the EU came as a surprise to just about everyone, and the pound's value on the world stage dropped dramatically. Over the space of a week it dropped from $1.47 to $1.29, recovering a little over the following few days - hovering around $1.32 (with normal market fluctuations seeing it range from $1.29 to $1.33).
Although this was a drop of about 12%, it was considerably less than predicted by some, and not as much as the 26% fall in 2008 (which took place over the space of a couple of months), or the 25% drop over 2 months in 1992.
By mid-August, 2016, the pound had stablised at around $1.32, but it started to fall again mid-September. The announcement of the Brexit timetable in early October added further downward pressure, stabilising at around $1.22 in the middle of the month.
It is important to note that the rates given here and on the other related pages are the inter-bank rates. These are not the rates that you or or I would get when buying dollars ahead of our holidays, or the rates applied to dollar purchases on our credit cards, or indeed the rates necessarily quoted by the media.
Apart from commission (clear, in the form of a percentage, or hidden, as a reduced exchange rate), the rates you will get are always several percent lower, and usually lag behind the inter-bank rate.
But to give a rough idea of what difference all this makes to your holiday cash, a change in rate of 1c from, say, $1.55 to $1.54 will result in it costing you about £4 for every $1000 that you spend. But the drop during October, 2008, would have seen $1000 costing about £100 more.
| << Dollar history from 1971 |